Visual discovery
Suitable AI image index
Browse images used across Suitable AI pages and published articles. Each image includes a descriptive caption and machine-readable metadata for search and discovery.
187 indexed images. Machine-readable index: JSON.
Brand imagery
5 images

Suitable AI site icon
Blue circular Suitable AI symbol used for the site icon and organization identity.

Suitable AI symbol logo
Compact blue Suitable AI symbol used in branded interface elements.

Suitable AI social sharing graphic
Suitable AI wordmark on a clean background for social sharing previews.

Suitable AI blue logo
Blue Suitable AI symbol and wordmark used for light website backgrounds.

Suitable AI white logo
White Suitable AI symbol and wordmark designed for dark backgrounds.
Engineering and team imagery
25 images
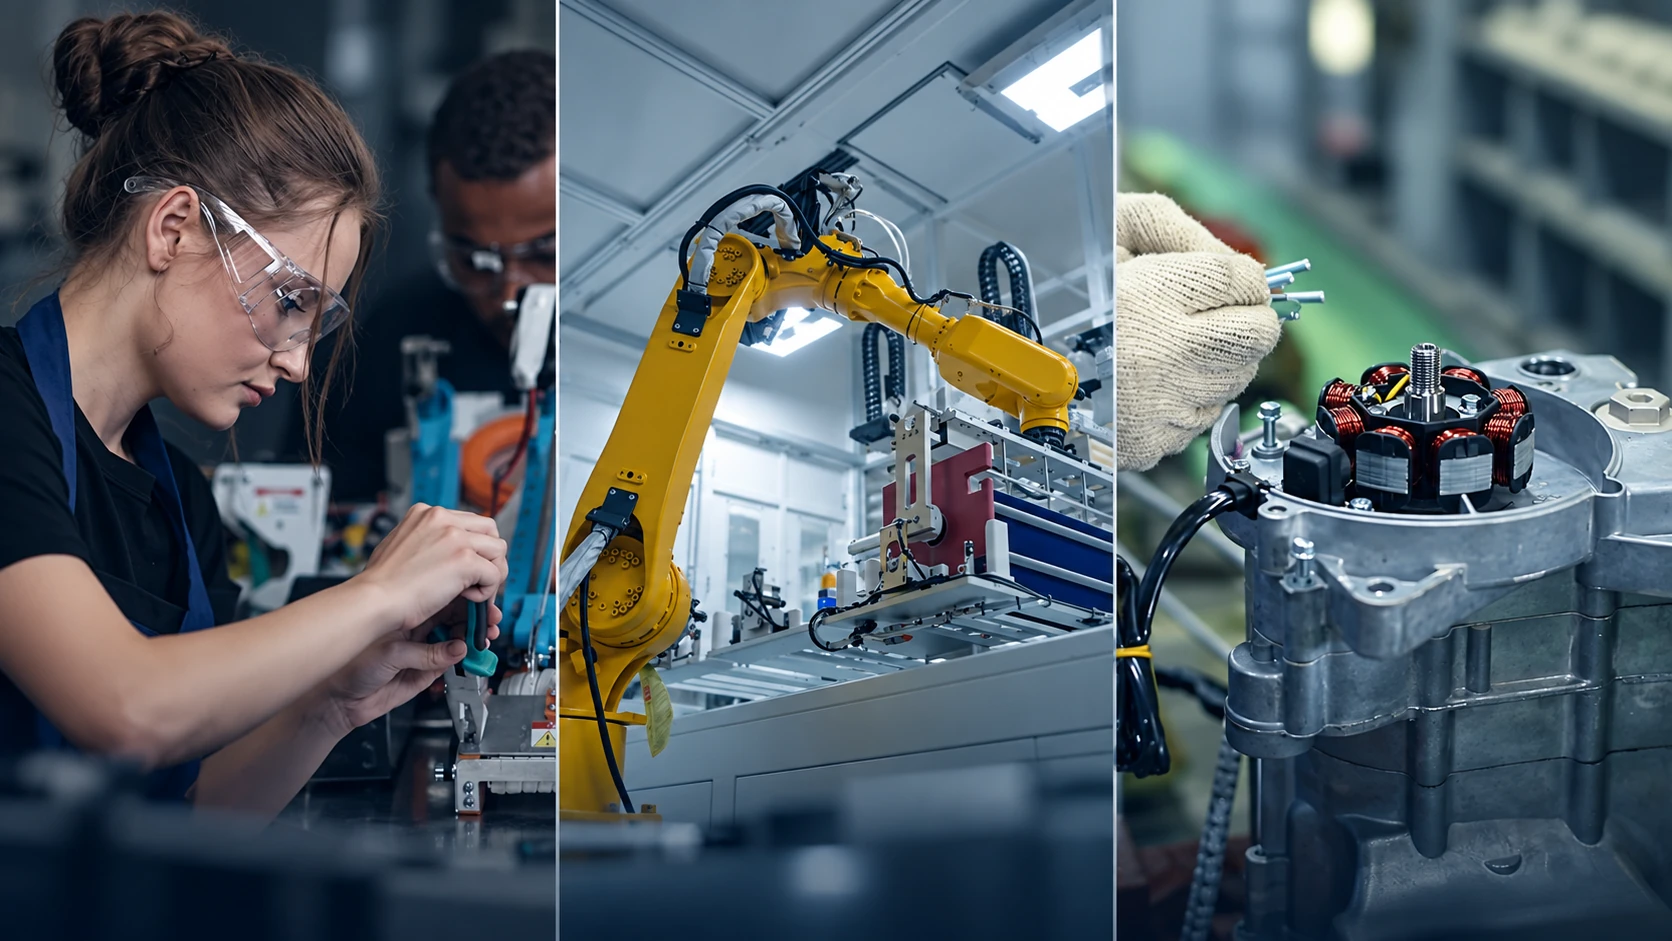
Engineering design and automation collage
Collage of electronics engineering and automated manufacturing work used in the engineering hero section.

Global technology at night
A satellite-style nighttime view of city lights across Earth, illustrating globally connected technology teams.

Modern office towers
Glass-and-steel office towers viewed from below, representing modern engineering workplaces and global capability centers.

Professional portrait in a white shirt
Studio portrait of a smiling male professional in a white shirt against a light background.

Semiconductor circuit board
Macro view of a green printed circuit board populated with semiconductor chips.

Close-up semiconductor package
Close-up of a semiconductor package and electronic traces on a circuit board.

Engineering team meeting
Colleagues gather around computers in an office meeting to review engineering work.

Team collaboration around a laptop
Three colleagues collaborate around a laptop at a shared work table.

Engineers working in a shared office
A small team works at laptops in a bright shared office.

SpaceX rocket launch
A SpaceX rocket lifts off through clouds of exhaust at launch.

Integrated-circuit design visualization
A digital visualization of an integrated circuit and its electronic pathways.

Digital systems interface
A dark technical interface shows multiple digital system diagrams and data panels.

Motorcycle on an open road
A motorcyclist travels along an open road during the evening.

Electric vehicle in a studio
A front view of an electric vehicle displayed in a dark studio setting.

Professional portrait in an office
A woman sits for a professional portrait in a modern office.

Clinician with a stethoscope
Close view of a clinician in a white coat holding a stethoscope.

Clinical team and diagnostic equipment
Masked healthcare professionals gather around clinical diagnostic equipment.

Engineering in a production facility
An engineer inspects equipment in a bright, high-tech production facility.

Manufacturing engineer inspecting a component
A manufacturing engineer examines a small component on a production floor.
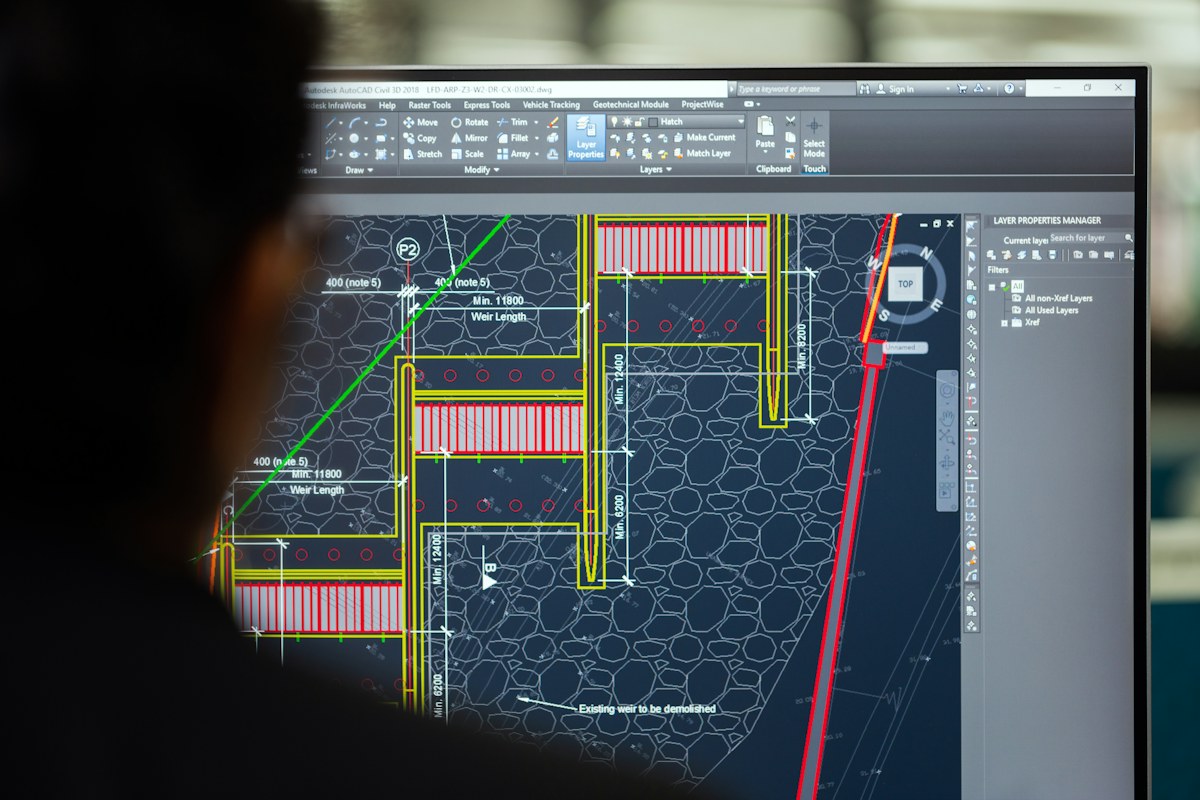
Semiconductor design screen
A monitor displays a detailed semiconductor or circuit-board design layout.

Electric vehicle engineering studio
A white electric car is shown in a modern engineering or testing studio.

Aerospace engine health analytics case study
Aerospace engineering concept artwork featured with the engine health analytics case study.

Aerospace UAV edge navigation
Illustration featured with the aerospace UAV edge-navigation case study.

Industrial mining fleet predictive maintenance
Mining haul-truck artwork featured with the industrial fleet predictive-maintenance case study.

Connected agricultural harvester telemetry
Agricultural combine artwork featured with the connected harvester telemetry case study.
Article featured images
156 images

Building a High-Accuracy Hiring Pipeline for Safety-Critical Systems Teams
Infographic illustrating the multi-stage 'Predictive Precision' hiring framework for safety-critical systems teams.
Build a high-accuracy hiring pipeline for safety-critical systems teams. Discover the "Predictive Precision" framework to mitigate risks and enhance outcomes. Learn how.
Open related article
Building a Calibration Blueprint for Senior Back-End Roles
Infographic illustrating a calibration blueprint framework for senior back-end roles, highlighting competencies and assessment methods.
Master senior back-end roles with a calibration blueprint. Define competencies, integrate assessments, and foster growth for top-tier talent. Learn how.
Open related article
How an Industrial Automation Firm Prevented Delivery Delays Through Faster Hiring
Infographic showing how an industrial automation firm reduced delivery delays by improving its hiring process and talent acquisition speed.
An industrial automation firm tackled critical delivery delays by optimizing its hiring process. Learn how faster talent acquisition fueled project success. Here's what works.
Open related article
Breaking Hardware Silos: An Engineering Manager's Guide to Cross-Disciplinary Systems Thinking
Engineering manager leading a cross-disciplinary team discussing a complex hardware system design on a whiteboard.
Overcome hardware development silos with cross-disciplinary systems thinking. Learn how engineering managers can foster collaboration for superior products. Learn how.
Open related article
From Reactive to Adaptive: A Blueprint for Self-Optimizing Manufacturing Facilities
Infographic illustrating the transition from reactive to self-optimizing manufacturing facilities, highlighting key benefits.
Transform manufacturing from reactive to adaptive with a self-optimizing blueprint. Boost efficiency, cut costs, and gain agility. Learn how.
Open related article
Improving Talent Quality in AI/ML Hiring Through Deep Technical Calibration
Infographic illustrating the benefits of deep technical calibration for AI/ML hiring, showcasing improved candidate quality and project acceleration.
Struggling with AI/ML hiring? Discover how deep technical calibration enhances talent quality, reduces costs, and accelerates innovation. Learn how.
Open related article
How Suitable AI Solved a Cross-Border Embedded Hiring Challenge for an EV Client
Infographic showing Suitable AI's AI-powered platform accelerating cross-border embedded hiring for an EV client, highlighting a 52% reduction in time-to-hire.
Discover how Suitable AI's AI-powered platform streamlined cross-border embedded hiring for an EV manufacturer, cutting time-to-hire by 52%. Learn more.
Open related article
Reducing Interview Fatigue by Eliminating Redundant Evaluation Rounds
Infographic illustrating the reduction of interview stages and improved candidate experience with Suitable AI's platform.
Eliminate redundant interview rounds to combat interview fatigue. Learn how Suitable AI optimizes hiring, reduces costs, and improves candidate experience. Discover the solution.
Open related article
How a MedTech Company Filled FDA-Critical Engineering Roles Faster
Infographic comparing MedTech hiring timelines before and after implementing a new recruitment strategy for FDA-critical engineering roles.
Struggling to hire FDA-critical engineers in MedTech? Discover how a targeted strategy can slash hiring times and accelerate product development. Learn how.
Open related article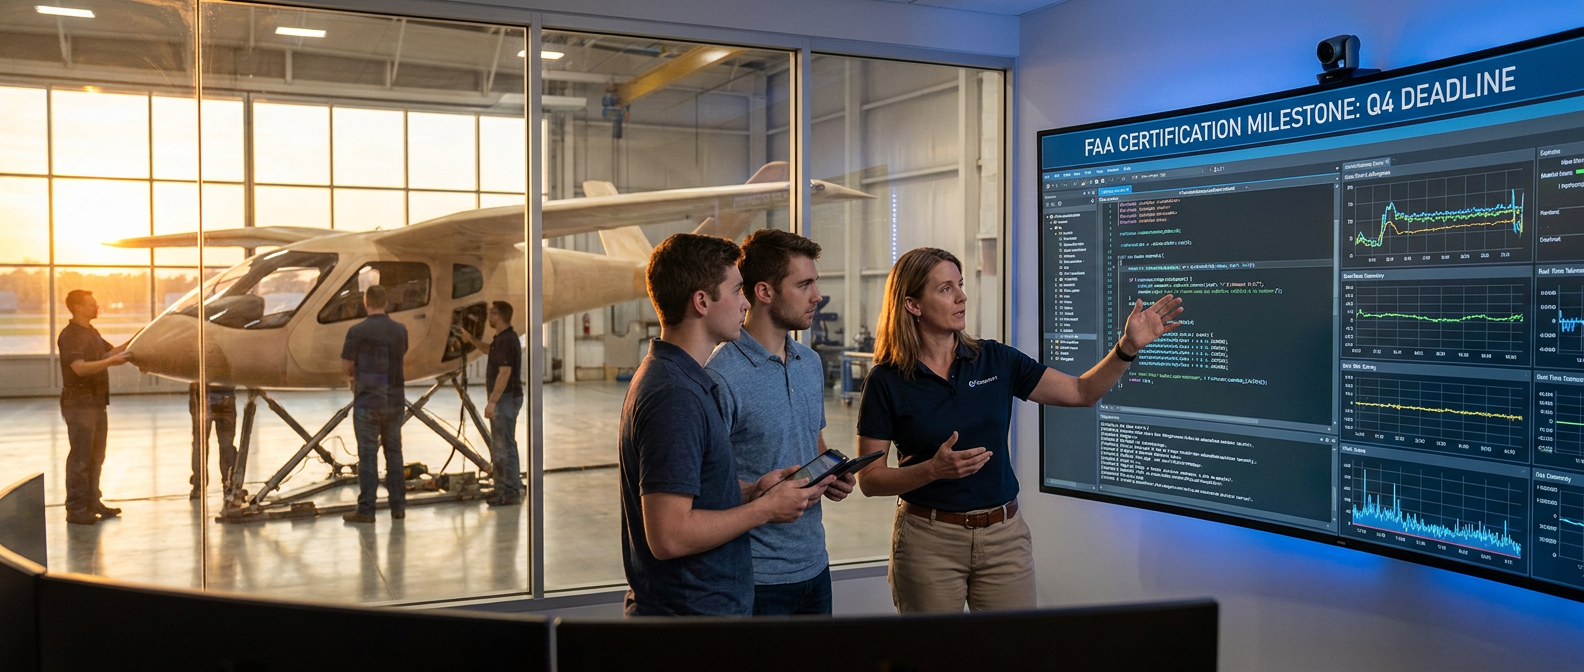
Accelerating Aerospace Software Hiring During Certification Deadlines
Infographic illustrating accelerated hiring timelines for aerospace software engineers facing certification deadlines.
Aerospace companies face certification deadlines. Learn how to accelerate specialized software hiring & improve candidate quality with strategic recruitment. Here's what works.
Open related article
How Predictive Hiring Helped Reduce Early Attrition in Engineering Roles
Infographic showing predictive hiring analytics reducing early attrition rates for engineering roles.
Discover how predictive hiring analytics significantly reduces early attrition in engineering roles. Learn data-driven strategies for better retention. Here's how.
Open related article
Rebuilding a Broken Technical Hiring Funnel for a High-Growth SaaS Team
Infographic illustrating a repaired and efficient technical hiring funnel for a high-growth SaaS team, showcasing key stages and improved metrics.
Fix your leaky technical hiring funnel to scale your high-growth SaaS team. Discover strategies for faster hiring & better quality hires. Learn how.
Open related article
How Suitable AI Helped an Automotive Client Hire AUTOSAR Engineers at Scale
Infographic showing how Suitable AI helps automotive clients hire AUTOSAR engineers at scale, reducing time-to-hire.
Our automotive client faced an AUTOSAR engineer shortage. See how Suitable AI's precision sourcing accelerated hiring and built scaled teams. Learn how.
Open related article
Reducing Offer Declines Through Candidate Experience Optimization
Infographic illustrating the positive impact of optimizing candidate experience on offer acceptance rates and time-to-hire.
Discover how to minimize offer declines by enhancing your candidate experience. Learn strategies to improve communication, streamline processes, and build a stronger employer brand. Here's what works.
Open related article
How a GCC Built Its India Engineering Hub Without Slowing Product Velocity
Infographic illustrating the strategic steps to establish a successful India engineering hub that accelerates product velocity for GCCs.
Discover how Global Capability Centers can build a high-velocity India engineering hub without slowing product development. Learn strategic approaches. Here's what works.
Open related article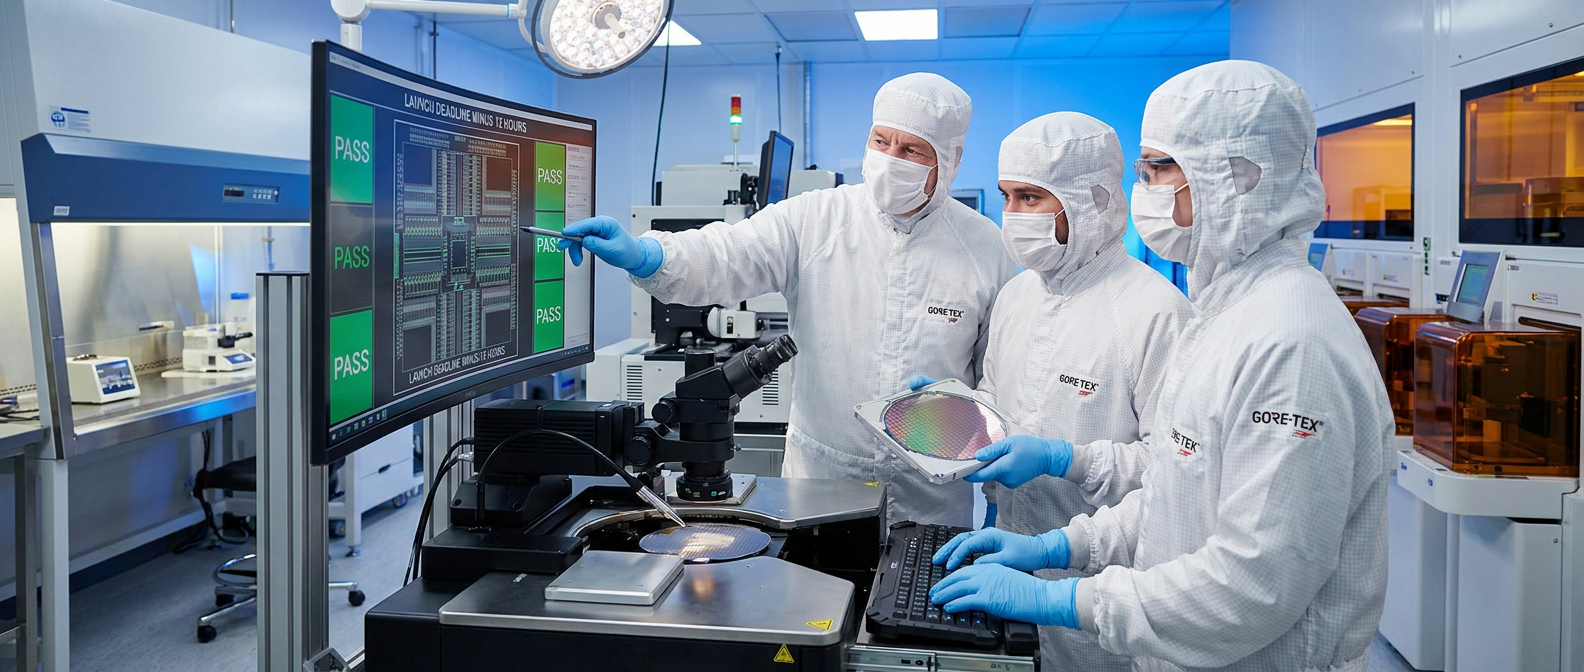
Closing Critical Semiconductor Roles Before Product Launch Delays Escalated
Infographic illustrating the impact of closing critical semiconductor roles on preventing product launch delays and ensuring market readiness.
Stop product launch delays by strategically closing critical semiconductor roles. Learn how to acquire specialized talent and maintain market leadership. Here's what works.
Open related article
Scaling Collaborative Engineering Teams Across Distributed Product Programs
Infographic illustrating the benefits of scaling collaborative engineering teams across distributed product programs.
Master scaling collaborative engineering teams across distributed product programs. Learn essential strategies for communication, workflows, and alignment. Here's what works.
Open related article
How AI-Led Hiring Reduced False Positives in Technical Interviews
Infographic illustrating how AI-led hiring reduces false positives in technical interviews, showcasing improved accuracy.
Discover how AI-led hiring eliminates false positives in technical interviews, ensuring you hire top talent efficiently. Learn about objective assessments and cost savings. Here's what works.
Open related article
Improving Embedded Systems Hiring Accuracy with Structured AI Screening
Infographic illustrating structured AI screening for embedded systems hiring, highlighting accuracy improvements.
Boost embedded systems hiring accuracy with structured AI screening. Reduce project delays and development costs. Learn how.
Open related article
How We Built a Niche Cloud Infrastructure Hiring Pipeline in 21 Days
Infographic detailing the 21-day cloud infrastructure hiring pipeline, showcasing key stages and timelines.
Discover how we built a niche cloud infrastructure hiring pipeline in just 21 days. Learn essential strategies for fast, effective tech talent acquisition. Here's what works.
Open related article
Reducing Hiring Mismatch in Software Teams Through Predictive Evaluation
Infographic illustrating the process of reducing hiring mismatches in software teams using predictive evaluation and AI.
Stop costly hiring mismatches in software teams. Discover how predictive evaluation identifies candidates with the right fit & potential for long-term success. Learn more.
Open related article
How an EV Company Cut Time-to-Hire for Battery Systems Engineers by 52%
Infographic showing a 52% reduction in time-to-hire for EV battery systems engineers.
Discover how an EV company slashed time-to-hire for Battery Systems Engineers by 52% using targeted sourcing, streamlined processes, and AI. Learn what works.
Open related article
How AI Calibration was utilized to Improve Shortlist Accuracy for Backend Engineering Roles
Infographic showing AI calibration improving backend engineering shortlist accuracy by reducing manual bottlenecks and bias.
Discover how AI calibration drastically improves shortlist accuracy for backend engineering roles, reducing time-to-hire and boosting candidate quality. Learn more.
Open related article
Inside the Hiring Funnel Redesign That Reduced Candidate Drop-Offs by 41%
Infographic comparing key recruitment metrics before and after hiring funnel redesign, highlighting a 41% reduction in candidate drop-offs.
Discover how a strategic hiring funnel redesign cut candidate drop-offs by 41%. Learn to enhance candidate experience & recruitment metrics. Here's what works.
Open related article
Closed an Aerospace Validation role faster than the entire market
Infographic showing a bar chart of traditional vs. AI-driven time-to-hire for aerospace validation roles, with Suitable AI significantly faster.
Discover how Suitable AI accelerated aerospace validation role hiring by 67%, overcoming bottlenecks and securing top talent faster than the market. Learn how.
Open related article
Hiring Speed Advantage in 2026
Infographic illustrating the 'Hiring Speed Advantage in 2026' with data points on time-to-hire and AI's impact.
Gain a hiring speed advantage in 2026. Discover data-driven strategies & AI tools to cut time-to-hire, secure top talent faster, and reduce costs. Learn how.
Open related article
The Adaptive Factory Framework: A CTO's Guide to Smart Plants
Diagram illustrating the three pillars of the Adaptive Factory Framework: data acquisition, intelligent analytics, and automated execution.
Unlock industrial agility with the Adaptive Factory Framework. Discover how to build smart plants for real-time optimization and resilience. Learn how.
Open related article
Software is Eating the Physical World: A 2026 Perspective
Infographic showing the exponential growth of IoT devices and market value in manufacturing.
Discover how "software is eating the physical world" impacts hiring. Learn to build hybrid teams for the future.
Open related article
Why India’s Drone Stack Needs Edge AI Specialists Now
Infographic illustrating the growing demand for Edge AI specialists in India's drone industry, highlighting key skillsets and applications.
India's drone sector is booming, but needs Edge AI specialists for true autonomy. Discover the skills and opportunities in this growing field. Learn how.
Open related article
Secure Comms, Secure Talent: The Software Skills Behind Modern Defence Systems
Infographic detailing essential software skills like cybersecurity, AI/ML, and cloud for modern defense systems.
Modern defense systems are built on complex software. Discover essential skills in cybersecurity, AI, and cloud to secure comms and talent. Learn more.
Open related article
Digital Twin Readiness for Aerospace Programs
Infographic illustrating the interconnected components and lifecycle applications of digital twins in aerospace programs.
Master digital twin readiness for aerospace programs. Learn how to integrate technology, manage data, and foster organizational change for program success. Here's what works.
Open related article
Continuous Engineering for Physical Products: The New Operating Model
Infographic contrasting traditional linear product development with the agile, iterative cycles of Continuous Engineering.
Discover Continuous Engineering, the new agile operating model transforming physical product development. Accelerate innovation and reduce costs. Learn how.
Open related article
From Reactive to Autonomous: The New Defence Engineering Hiring Frontier
Infographic depicting a shift from reactive to autonomous hiring in defence engineering, highlighting AI and autonomous systems.
Defence engineering talent acquisition is shifting from reactive to autonomous. Discover new strategies for AI, autonomy, and cybersecurity engineers. Learn how.
Open related article
How Avionics Software Teams Reduce Certification Risk
Infographic illustrating key risks and mitigation strategies for avionics software certification.
Avionics software teams face high certification risk. Discover strategies to reduce risk, navigate DO-178C, and accelerate development. Learn how.
Open related article
The EV Calibration Stack: From Test Bench to Road
Infographic illustrating the EV calibration stack journey from test bench to road, highlighting key components like MBD, data acquisition, and HIL simulation.
Master the EV calibration stack: from test bench to road. Optimize EV performance, safety & efficiency with MBD, data acquisition & HIL. Learn how.
Open related article
Listening to Machines: The Basics of Predictive Maintenance
Diagram illustrating the predictive maintenance process, showing sensors collecting data and AI analyzing it for early failure detection.
Learn the basics of predictive maintenance (PdM) and how it uses data to forecast failures before they happen. Minimize downtime and extend equipment life. Discover the key technologies and benefits.
Open related article
The Hidden Cost of Slow Vehicle Software Validation
Infographic illustrating the escalating costs and inefficiencies associated with delayed vehicle software validation processes.
Discover the hidden costs of slow vehicle software validation, from ballooning budgets to reputational damage. Accelerate your time-to-market. Learn how.
Open related article
Rewriting Battery Intelligence: Why Software Now Owns Charge Strategy
Infographic illustrating the shift from hardware-centric to software-defined battery charge strategy with AI.
Discover how intelligent software, not just hardware, now dictates battery charge strategy for EVs & more. Optimize performance, longevity & cost. Learn how.
Open related article
Quantum is moving from physics lab language to systems engineering language
Diagram illustrating the transition of quantum computing from theoretical physics concepts to practical systems engineering applications.
Quantum computing is evolving from theoretical physics to systems engineering. Learn how this crucial shift unlocks its real-world potential. Here's what works.
Open related article
Safe and Trusted AI is becoming Engineering Infrastructure, not policy theatre
Infographic illustrating the shift from AI safety as policy theatre to a concrete engineering infrastructure.
Discover the critical shift: AI safety is now engineering infrastructure, not just policy. Learn how verifiable mechanisms build trust and responsible AI by design. Discover what works.
Open related article
India’s Space Economy is shifting from launches to Commercial Infrastructure
Infographic illustrating India's space economy shift from rocket launches to satellite constellations and in-orbit servicing.
India's space economy is shifting focus from launches to building robust commercial infrastructure. Discover the key pillars and opportunities.
Open related article
The “Co-Engineering Shift”
Infographic illustrating the key principles and benefits of the Co-Engineering Shift in product development, emphasizing collaboration and shared vision.
Explore the Co-Engineering Shift, a new paradigm in product development where shared ownership and integrated teams drive innovation and faster time-to-market. Learn how.
Open related article
Why Factories are becoming decision-making systems
Infographic illustrating a factory transforming into an AI-driven decision-making system with interconnected IoT devices and data analytics.
Discover how factories are becoming AI-powered decision-making systems. Learn about IoT, AI, and advanced analytics driving efficiency and uptime. Here's what works.
Open related article
Why EVs are turning into Software platforms
Infographic illustrating how electric vehicles are evolving into software platforms with key components like centralized compute, connectivity, and OTA updates.
Electric vehicles are transforming into sophisticated software platforms, blurring lines and creating new revenue streams. Discover the pillars of this automotive industry transformation. Learn how.
Open related article
Software Defined Everything (SDE)
Diagram illustrating the core components and principles of Software Defined Everything (SDE), showing abstraction, programmability, and automation.
Discover Software-Defined Everything (SDE), the architectural paradigm that abstracts IT infrastructure for dynamic control. Learn how SDE boosts agility, efficiency, and innovation. Explore its evolution from SDN and key technologies. Get the insights you need to transform your IT operations. Learn how.
Open related article
AI data centers are becoming the new Engineering battlefield
Infographic illustrating the explosive growth and demands of AI data centers as the new engineering battlefield, highlighting compute power, power density, and networking.
Explore why AI data centers are the critical battleground for technological dominance, demanding specialized infrastructure and expertise. Learn about power, cooling, and the geopolitical implications.
Open related article
Industrial AI OS
Infographic illustrating the components and benefits of an Industrial AI OS, showing data flow from sensors to AI-driven insights for manufacturing.
Explore the Industrial AI OS, unifying IT/OT for efficiency, predictive maintenance, and autonomous decisions. Unlock operational agility. Learn how.
Open related article
WHAT MBSE REALLY MEANS FOR AEROSPACE
Infographic illustrating the core principles and benefits of Model-Based Systems Engineering (MBSE) in the aerospace industry.
Discover what Model-Based Systems Engineering (MBSE) truly means for aerospace. Learn how it transforms design, boosts collaboration, and reduces costs. Here's the breakdown.
Open related article
Semiconductor packaging is becoming India’s real chip battleground
Infographic illustrating India's growing role in semiconductor packaging with statistics and key growth drivers.
India is rapidly emerging as a leader in semiconductor packaging, crucial for global supply chain resilience. Learn how this sector is transforming India's tech landscape. Discover what works.
Open related article
Merging Data Streams: Sensor Fusion for Real-Time Threat Analysis
Infographic illustrating sensor fusion by combining data from radar, EO/IR, and EW systems for enhanced threat analysis.
Discover how sensor fusion merges disparate data streams for real-time threat analysis. Enhance situational awareness and make faster decisions. Learn more.
Open related article
Zero Latency: The Architecture of Local Defense AI
Diagram illustrating the multi-layered architecture of zero-latency defense AI, emphasizing edge processing and rapid decision-making.
Discover the architecture of zero-latency defense AI, crucial for sub-millisecond response times. Learn how hardware, software, and data management enable instant action.
Open related article
The Integration Nightmare: Legacy Hardware Meets Modern AI
Diagram illustrating the challenges of integrating modern AI with legacy defense hardware, highlighting data silos and communication gaps.
Struggling to integrate AI with legacy defense hardware? Uncover the 'integration nightmare' causes and discover strategies for seamless data conversion, processing, and security. Learn how.
Open related article
Tactical AI: Processing Power on the Battlefield
Infographic illustrating tactical AI processing power on the battlefield with decentralized edge computing nodes.
Explore tactical AI (edge AI in defense) & its processing power on the battlefield. Learn how distributed AI ensures responsiveness & operational superiority.
Open related article
The Autonomy Leap: Why Current Drones Are Just Automated
Diagram illustrating the difference between automated drone pre-programmed pathways and truly autonomous drone decision-making under uncertainty.
Discover the critical difference between automated drones and true autonomy in defense. Learn why this distinction matters for strategic advantage and future tech. Learn how.
Open related article
Bridging the Gap: Data Continuity from Engineering to Operators
Infographic illustrating the flow of data continuity from aerospace engineering design to operational and maintenance crews.
Bridge the data gap from aerospace engineering to operators. Ensure design insights empower maintenance and operations. Learn how.
Open related article
Future of electric vehicle mobility in India
Graph showing the projected growth of electric vehicle adoption and infrastructure in India, illustrating the future of EV mobility.
Explore the exploding future of electric vehicle mobility in India. Discover key drivers, government support, and tech advancements shaping India's EV ecosystem. Learn how.
Open related article
The Simulation Dividend: Saving Capital in Aerospace R&D
Infographic illustrating capital savings in aerospace R&D through simulation and virtual testing.
Unlock significant capital savings in aerospace R&D with advanced simulation. Reduce prototyping costs, mitigate rework, and accelerate development. Learn how.
Open related article
Architecting V2C Sync: Overcoming Latency in Moving Vehicles
Diagram illustrating Vehicle-to-Cloud (V2C) synchronization architecture with focus on minimizing latency for moving vehicles.
Master V2C synchronization for moving vehicles. Learn architectural patterns & technologies to overcome high latency and ensure data integrity on the go. Learn how.
Open related article
Traceability Mandates: Passing Aerospace Compliance via Digital Models
Infographic illustrating the digital thread connecting design, manufacturing, supply chain, and maintenance for aerospace traceability.
Unlock aerospace compliance with digital models. Ensure end-to-end traceability and meet mandates like AS9100. Learn how Suitable AI streamlines audits. Discover effective strategies now.
Open related article
From CAD to Maintenance: Mapping the Digital Thread
Infographic illustrating the digital thread's connection from CAD design to product maintenance.
Understand the digital thread connecting CAD to maintenance. Unlock seamless data flow, improve quality, and reduce costs. Learn how.
Open related article
Building an OTA Data Pipeline: The Operational Playbook
Diagram illustrating the foundational architecture of an Over-the-Air (OTA) data pipeline for automotive software updates.
Master building a robust OTA data pipeline for seamless, secure vehicle software delivery. Learn key objectives, governance, and tech stack for CTOs. Here's what works.
Open related article
From Back-Office to AI Frontline: How the 2024 GCC Boom is Rewiring India’s Tech Talent Pipeline
Infographic illustrating the shift in India's tech talent pipeline due to GCC investment, highlighting AI and cloud job growth.
The 2024 GCC boom is reshaping India's tech talent pipeline. Discover how AI, cloud, and cybersecurity roles are in high demand. Learn how.
Open related article
Squeezing Range: The Software Secret to Battery Optimization
Infographic comparing basic and advanced BMS features and their impact on EV range and battery optimization.
Discover how sophisticated software, not just hardware, is the secret to maximizing EV range. Engineering managers, learn the software-first approach for better optimization. Here's what works.
Open related article
Demystifying Zonal Architecture for the Non-Engineer
Diagram illustrating zonal architecture in a vehicle, showing zones and domain controllers.
Demystify zonal architecture: a revolutionary vehicle E/E system. Learn how it simplifies wiring, boosts scalability & enables OTA updates for Software-Defined Vehicles. Learn how.
Open related article
Why the SDV Era Requires Silicon Valley Talent in Detroit
Infographic illustrating the shift from hardware-centric to software-defined vehicles, highlighting the need for Silicon Valley talent in Detroit.
Detroit's automotive future hinges on Software-Defined Vehicles (SDVs). Learn why Silicon Valley talent and culture are crucial for this transition. Discover strategies to bridge the gap. Learn how.
Open related article
Bridging the Golang Talent Gap: Strategies for Rapid Sourcing
Infographic detailing strategies for rapid Golang talent sourcing in India, emphasizing skill mapping and community engagement.
Bridge the Golang talent gap in India with advanced sourcing strategies. Learn to identify niche skills, engage passive candidates, and accelerate hiring for top tech roles. Here's what works.
Open related article
Agile for Hardware: Applying CI/CD to Physical Products
Infographic illustrating the application of CI/CD principles to hardware development cycles, emphasizing integration and deployment.
Discover how CTOs can apply CI/CD to hardware development, bridging the gap between software agility and physical product innovation. Learn actionable steps to accelerate time-to-market.
Open related article
Accelerating Innovation: Systems Thinking for the Modern Tech Executive
Infographic illustrating systems thinking principles for accelerating innovation in tech organizations.
Unlock innovation for modern tech executives with systems thinking. Learn to break down silos, optimize product development, and drive adaptability. Discover actionable strategies.
Open related article
Breaking Silos: How Connected Data Accelerates Hardware Launches
Infographic illustrating a connected data platform accelerating hardware launch timelines by breaking down silos.
Break hardware development silos with connected data. Slash launch times, minimize rework, and boost collaboration for faster, cheaper product releases. Learn how.
Open related article
Teardown: Eliminating 3 Extra Interview Rounds to Prevent Drop-Off
Infographic illustrating the reduction of interview rounds to prevent candidate drop-off in tech hiring.
Eliminate extra interview rounds to prevent candidate drop-off & speed up hiring. Discover 3 stages to cut for a more efficient, quality-driven recruitment process. Learn how.
Open related article
Auto-Correcting Pipelines: The Power of Closed-Loop Hiring
Infographic illustrating the continuous feedback loop of a closed-loop hiring system, highlighting data integration, algorithmic refinement, and automated adjustments.
Transform hiring with closed-loop systems. Learn how auto-correcting pipelines elevate candidate quality and efficiency. Discover the power of continuous feedback.
Open related article
The 72-Hour Backfill: Myth or Mathematical Reality?
Infographic illustrating the concept of a 72-hour backfill for senior roles, highlighting AI optimization.
Challenge the myth of slow senior hires. Discover the mathematical reality behind the 72-hour backfill and how AI optimizes talent acquisition for rapid, quality placements. Learn how.
Open related article
Compliance as Code: Risk Management for Remote Hubs
Diagram illustrating the core principles of Compliance as Code for risk management in remote business hubs.
Manage risk for remote hubs with Compliance as Code. Automate adherence to global mandates and ensure consistent regulatory alignment. Learn how.
Open related article
The Explainability Playbook: Gaining Team Buy-In for AI Tools
Infographic depicting the AI explainability playbook with steps for gaining team buy-in for AI tools.
Learn how to gain team buy-in for AI tools with our explainability playbook. Demystify AI, build trust, and drive adoption. Discover actionable steps for success.
Open related article
Emergency Replacements: Maintaining Velocity When Senior Leads Leave
Infographic illustrating the accelerated process for emergency senior engineering leadership replacements to maintain team velocity.
Sudden departures of senior engineering leaders can stall projects. Learn how to implement an emergency replacement strategy to maintain team velocity and institutional knowledge.
Open related article
Re-engineering the Hiring Matrix: A Template for Structured Scoring
Infographic comparing structured hiring matrix with traditional methods, highlighting AI integration for objective scoring.
Move beyond bias with a structured hiring matrix template. Quantify feedback, standardize assessment, and build an objective talent framework. Learn how.
Open related article
Loop the Feedback: Turning Post-Interview Surveys into Calibration Data
Infographic illustrating the process of turning post-interview feedback into calibration data for AI hiring tools.
Transform post-interview surveys into actionable calibration data for your technical screening AI. Discover how to improve hiring accuracy with feedback loops. Learn how.
Open related article
The Agile Bandwidth Template: Forecasting Hiring Needs
Diagram illustrating the Agile Bandwidth Template steps for forecasting engineering hiring needs.
Discover the Agile Bandwidth Template to forecast engineering hiring needs. Optimize recruitment, avoid bottlenecks, and scale effectively with Suitable AI insights.
Open related article
Opening the Black Box: How to Read Predictive Hiring Data
Infographic illustrating the key components and interpretation of predictive hiring data for AI-driven talent acquisition.
Unlock the power of predictive hiring data. Understand how AI analyzes skills, behaviors, and past performance to forecast candidate success. Learn more.
Open related article
Capacity Mapping: Defending Against Mid-Sprint Resignations
Infographic illustrating the five steps of capacity mapping to defend against mid-sprint resignations and maintain project timelines.
Defend your engineering team against mid-sprint resignations with effective capacity mapping. Learn to predict outcomes, identify risks, and maintain sprint velocity. Here's how.
Open related article
The False Positive Trap: Auditing Your Technical Screening
Infographic illustrating the process of auditing technical screening to identify and reduce false positives in candidate selection.
Discover how to audit your technical screening process and eliminate costly false positives. Identify and fix common pitfalls to ensure you hire top technical talent. Learn how.
Open related article
Vacancy Cost Calculator: The True Price of a 60-Day Hiring Cycle
Infographic illustrating the financial cost of a 60-day engineering hiring cycle, highlighting direct and indirect expenses.
Uncover the hidden financial drain of prolonged engineering hiring cycles. Use a vacancy cost calculator to quantify lost productivity and reduce your time-to-hire. Learn how.
Open related article
Preparing for the Q4 Global Tech Audit
Infographic outlining a checklist for preparing for the Q4 global tech audit, focusing on vendor compliance and risk management.
Ace your Q4 global tech audit. Our checklist guides procurement leaders on vendor compliance, IP protection, and risk mitigation for operational continuity. Learn how.
Open related article
Why Empty Desks Destroy Your Q3 Product Roadmap
Infographic illustrating the significant financial and strategic cost of unfilled engineering positions on Q3 product roadmaps and overall business objectives.
Unfilled engineering roles kill Q3 product roadmaps & revenue. Learn the hidden costs & how strategic hiring accelerates development. Discover the ROI. | Suitable AI
Open related article
Designing a Borderless Entity Structure for Software Talent
Infographic illustrating the benefits of a borderless entity structure for software companies seeking global talent.
Design a borderless entity structure to hire global software talent. Learn how to navigate legal, HR, and financial complexities for international growth. Here's how.
Open related article
Tracking Engineering Success: Beyond the 90-Day Mark
Infographic illustrating the evolution of engineering success metrics beyond the initial 90-day onboarding period.
Go beyond the 90-day mark to truly measure engineering success. Discover how to cultivate talent density and drive long-term innovation with a comprehensive framework. Learn more.
Open related article
The Predictive Enterprise Teardown: How Real-Time Product Feedback Loops Destroy Traditional R&D
Infographic illustrating the transition from traditional R&D to a predictive enterprise with real-time product feedback loops.
Learn how real-time product feedback loops dismantle traditional R&D, enabling predictive enterprises to innovate faster and de-risk investments. Discover the future of product development.
Open related article
Accelerating Time-to-Slate: A Checklist for Autonomous Velocity
Infographic detailing a checklist for accelerating time-to-slate in autonomous hiring processes.
Slash time-to-slate with our autonomous velocity checklist. Discover how to optimize role requirements, leverage AI, and streamline interviews to hire top tech talent faster.
Open related article
Building a Calibration Blueprint for Senior Back-End Roles
Infographic illustrating the key components of a calibration blueprint for hiring senior back-end roles.
Struggling to hire senior back-end engineers? Learn to build a calibration blueprint for consistent, unbiased evaluations and strengthen your engineering team. Expert strategies.
Open related article
Breaking Hardware Silos: An Engineering Manager's Guide to Cross-Disciplinary Systems Thinking
Infographic illustrating the benefits of cross-disciplinary systems thinking in hardware and software engineering.
Learn how Engineering Managers can use Systems Thinking to bridge hardware and software silos, fostering collaboration and innovation for better product development. | Suitable AI
Open related article
7 Data Connectivity Benchmarks Separating Legacy Manufacturers from Agile Product Innovators
Infographic outlining 7 data connectivity benchmarks for agile manufacturing, contrasting legacy vs. innovator approaches.
Identify your manufacturing data connectivity gaps. Learn 7 key benchmarks to transition from legacy systems to agile product innovation with real-time data access and interoperability. Discover the Suitable AI advantage.
Open related article
Analyzing Q2 Engineering Demand in India's Hubs
Infographic showing Q2 engineering job demand across key Indian tech hubs like Bengaluru, Hyderabad, and Pune.
Analyze Q2 engineering demand in India's tech hubs. Discover key insights for optimizing your Q3 hiring targets and GCC talent acquisition. Learn how.
Open related article
Hardware is the New Software: Deploying Continuous Engineering Lifecycles in Physical Products
Infographic illustrating the shift towards continuous engineering lifecycles for physical products, with overlapping hardware and software development stages.
Discover how continuous engineering lifecycles are transforming physical products. Learn strategies for hardware CI/CD, OTA updates, and agile manufacturing. | Suitable AI
Open related article
Maximizing Signal-to-Noise in 45-Minute Engineering Interviews
Infographic showing a structured 45-minute engineering interview flow to maximize signal-to-noise.
Turn 45-minute engineering interviews into signal-rich assessments. Discover how to define success, structure interviews, and uncover true candidate potential. Learn how.
Open related article
Stop Hoarding Dark Data: How to Translate Live Telemetry into Immediate Operational Intelligence
Infographic illustrating the transformation of raw telemetry data into actionable operational intelligence.
Stop hoarding dark data. Learn how to translate live telemetry into immediate operational intelligence for efficiency and competitive advantage.
Open related article
Stress-Testing Operations: How Factory Simulation Prevented a $5M Supply Chain Bottleneck
Infographic illustrating how factory simulation identified and prevented a critical supply chain bottleneck, saving millions in potential losses.
Discover how factory simulation and digital twins prevented a $5M supply chain bottleneck, ensuring operational resilience and cost savings. Learn proactive risk mitigation strategies.
Open related article
From Reactive to Adaptive: A Blueprint for Self-Optimizing Manufacturing Facilities
Infographic illustrating the transition from reactive to adaptive manufacturing facilities, highlighting AI and data integration.
Move beyond reactive manufacturing to adaptive operations. Discover how to build a self-optimizing factory for resilience and competitive edge. Learn how.
Open related article
The End of Scheduled Downtime: Calculating the Payback on Predictive Factory Maintenance
Infographic illustrating the financial benefits of AI-powered predictive factory maintenance over traditional scheduled downtime.
Discover the financial impact of predictive maintenance vs. scheduled downtime. Calculate ROI and boost factory efficiency with AI. Learn how.
Open related article
The Hidden Cost of Niche Skill Gaps in India's Software Talent Pool
Infographic illustrating the cascading impact of niche skill shortages on product development timelines and innovation in India's tech industry.
Discover the significant hidden costs of niche skill gaps in India's software talent pool, impacting product delays and innovation. Learn how to navigate this challenge. Here's what works.
Open related article
Microseconds Matter: Architecting Local Decision Systems for Next-Gen Tactical Dominance
Diagram illustrating the architecture of local decision systems for tactical dominance, highlighting edge computing and AI integration.
Discover how architecting local decision systems (LDS) with reduced latency enables next-gen tactical dominance. Learn essential pillars for edge computing and AI. Learn how.
Open related article
The 5-Minute Setup: Accelerating Your India Engineering Hub
Checklist graphic illustrating steps for setting up an engineering hub in India, focusing on compliance and acceleration.
Fast-track your India engineering hub setup with this 5-minute audit checklist. Address compliance, legal, and operational readiness for rapid, compliant deployment.
Open related article
Your 3D Dashboard Isn't a Digital Twin: Redefining Industrial Modeling
Infographic illustrating the difference between a 3D dashboard and a digital twin for industrial modeling.
Understand the crucial differences between a 3D dashboard and a digital twin for industrial modeling. Learn when each is sufficient for operational intelligence. | Suitable AI
Open related article
The Sensor Fusion Audit: Benchmarking the Speed of Situational Awareness Systems
Diagram illustrating the flow of data from multiple sensors to a central processing unit for sensor fusion in a defense system.
Discover how to audit sensor fusion systems for optimal speed. Learn to benchmark latency, improve update rates, and enhance real-time situational awareness. Here's how.
Open related article
Deconstructing the Nightmare: The Hidden Engineering Costs of Legacy Defense Integration
Infographic illustrating the complex and hidden engineering costs associated with integrating modern AI into legacy defense systems.
Discover the hidden engineering costs of legacy defense integration. Learn why modern AI integration with old systems is complex and expensive. Find mitigation strategies. Learn how.
Open related article
2026 Salary Trends: Why Open Seats Cost More Than Market Adjustments
Infographic illustrating the escalating cost of engineering job vacancies in India during 2026, emphasizing the financial impact over salary adjustments.
Discover why 2026 engineering salary trends in India show vacant seats cost more than market adjustments. Learn how to mitigate this "vacancy drain".
Open related article
Edge Intelligence Demystified: The Tactical Advantages of Decentralized Defense AI
Infographic illustrating the key tactical advantages of decentralized defense AI through edge intelligence, highlighting reduced latency and enhanced autonomy.
Unlock the tactical advantages of decentralized defense AI with edge intelligence. Discover faster threat detection, improved autonomy, and enhanced security. Learn how.
Open related article
Scripts vs Synapses: The Practical Engineering Leap from Defense Automation to Autonomy
Infographic illustrating the evolution from scripted automation to autonomous systems in defense, highlighting the 'synaptic' approach and AI integration.
Explore the critical engineering shift from scripted defense automation to true autonomy. Understand the 'synaptic' approach for adaptable, AI-driven defense applications. Learn how.
Open related article
Why Disconnected Aerospace Data is the Ultimate Liability in 2026 Programs
Infographic illustrating disconnected aerospace data leading to program liabilities by 2026.
In 2026, disconnected aerospace data is a critical liability. Learn why digital continuity is essential for program success and how to avoid costly failures. Here's what works.
Open related article
The EoR Tax: When to Shift to a Direct GCC Model
Infographic comparing EoR and GCC models, highlighting cost structures and strategic benefits for global expansion.
Discover when the 'EoR tax' outweighs the benefits of an Employer of Record, making a direct GCC model the smarter financial choice for global expansion. Learn how.
Open related article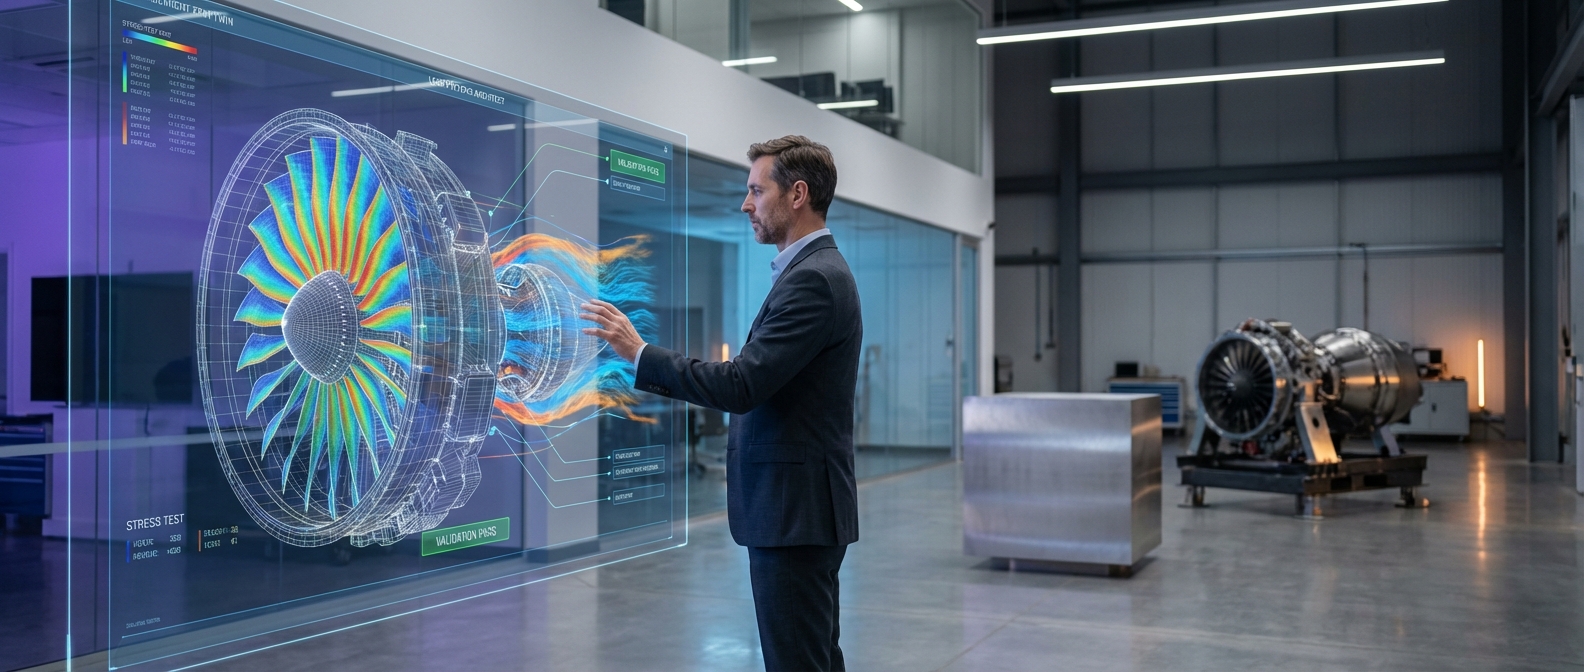
Virtual First: Architecting Validation Frameworks Before Spending Millions on Physical Aerospace Builds
Infographic illustrating the key steps in architecting virtual validation frameworks for aerospace, emphasizing cost reduction and faster time-to-market.
Architect robust virtual validation frameworks for aerospace. Cut millions in physical build costs and accelerate development. Learn how.
Open related article
Eradicating Bias: The Explainable ROI of AI in Sourcing
Infographic illustrating the explainable ROI of AI in eradicating bias in candidate sourcing, showing cost savings and efficiency gains.
Discover the explainable ROI of eradicating bias with AI in sourcing. Quantify cost savings, improved hiring, and diversity gains. Learn how.
Open related article
Averting Launch Delays: How Perfect Traceability Streamlines Aerospace Certification
Infographic illustrating the unbroken digital thread of aerospace traceability from requirements to certification.
Aerospace certification delays are costly. Discover how perfect traceability creates an unbreakable digital thread to streamline approvals and accelerate launches. Learn how.
Open related article
The Digital Thread is Not a Dashboard: Bridging the Aerospace Engineering Divide
Diagram illustrating the interconnected data flow of a true digital thread in aerospace engineering, contrasting it with a static dashboard view.
Aerospace CTOs: Is your digital thread just a dashboard? Understand the crucial difference for true digital transformation. Learn what works.
Open related article
Predictive Models vs Gut Feel: Who Wins in 2026?
Infographic comparing predictive models and gut feel in hiring, highlighting data-driven advantages for 2026.
Gut feel hiring is outdated. Discover why predictive models are crucial for talent acquisition in 2026, ensuring accuracy and reducing costs. Learn how.
Open related article
Data on Wheels: Deconstructing Real-Time Cloud Feedback Loops in Next-Gen EVs
Infographic illustrating the real-time cloud feedback loop in next-generation electric vehicles, showing data flow from sensors to cloud and back.
Deconstruct the real-time cloud feedback loop powering next-gen EVs. Learn how data, AI, and edge processing create smarter vehicles. Discover the future of automotive.
Open related article
7 Model-Based Systems Engineering Principles Every Aerospace Lead Needs to Master
Infographic illustrating 7 key Model-Based Systems Engineering (MBSE) principles for aerospace leadership, highlighting efficiency and collaboration.
Master 7 essential Model-Based Systems Engineering (MBSE) principles crucial for aerospace leads. Drive efficiency, collaboration, and innovation. Learn how.
Open related article
The 2026 India GCC Explosion: Legal Realities You Cannot Ignore
Infographic illustrating the projected growth of Global Capability Centers (GCCs) in India by 2026, highlighting key legal compliance areas.
India's GCC boom is set for 2026. Avoid costly liabilities by mastering labor, data privacy, IP, tax, and FEMA laws. Learn compliance essentials now.
Open related article
Hardware vs Software Battery Management: Where the True EV Performance Gains Live
Infographic comparing hardware and software contributions to EV battery performance, highlighting range and charging speed gains.
Discover where true EV battery performance gains lie: hardware's foundation vs. software's intelligence. Unlock range, charging speed & longevity. Learn more.
Open related article
OTA Updates Aren't Features, They're Operating Models: The Next Automotive Shift
Infographic comparing OTA as a feature vs. an operating model for automotive
Discover why Over-the-Air (OTA) updates are the core operating model for software-defined vehicles, driving continuous value and agility in the automotive industry. Learn how.
Open related article
2026 Benchmarks: Is Your 45-Day Hiring Cycle Now Obsolete?
Infographic detailing 2026 engineering hiring benchmarks, showing a shift from 45-day cycles to longer averages and the success of faster companies.
Is your 45-day hiring cycle obsolete for engineering roles in 2026? Industry benchmarks show a significant shift. Learn how top companies are achieving faster time-to-hire. Here's what works.
Open related article
Decoding Zonal Architecture: Structuring Engineering Teams for the EV Era
Diagram illustrating zonal architecture for electric vehicle engineering teams, highlighting interconnected functional zones.
Unlock EV development with zonal architecture. Discover how to structure engineering teams for innovation and speed. Learn the blueprint for success. Here's how.
Open related article
The Software-Defined Vehicle: Translating Automotive Code to C-Suite Value
Infographic illustrating the key components and benefits of a Software-Defined Vehicle (SDV), showcasing code to C-suite value.
Unlock the C-suite value of Software-Defined Vehicles (SDVs). Learn how automotive code translates to new revenue streams & enhanced customer experiences. Learn more.
Open related article
ideaForge and the Rise of India’s Indigenous War Tech
ideaForge drones in formation, showcasing India's indigenous war technology and defense capabilities.
Explore ideaForge, the pioneer of India's indigenous war tech. Discover how their advanced drones are transforming national security and defense manufacturing. Learn how.
Open related article
Maximizing Offer Acceptance Rates in a Competitive Market
Infographic illustrating 9 strategies to increase offer acceptance rates in a competitive job market.
Boost your Offer Acceptance Rate (OAR) in competitive markets. Discover 9 actionable strategies focusing on speed, transparency, and candidate experience. Learn how.
Open related article
GCC India: A Success Story in Compliance and Talent Acquisition
Infographic illustrating how GCCs in India leverage compliance and innovation to attract and retain top talent, showcasing career growth and strategic opportunities.
Discover how leading GCCs in India are transforming compliance into a powerful tool for attracting top talent and driving strategic growth. Learn how 'Trust Arbitrage' and governed innovation are key.
Open related article
Benchmarking Your Time-to-Shortlist: Are You Too Slow?
Infographic comparing Time-to-Shortlist benchmarks across industries in 2026.
Discover 2026 Time-to-Shortlist (TTS) benchmarks & strategies to accelerate your hiring. Learn how speed impacts candidate experience & ROI. Learn how.
Open related article
Time-to-Value (TTV) for New Hires: How Fast Can Your Engineers Become Productive?
Infographic illustrating the reduction in Time-to-Value (TTV) for new engineering hires with AI-assisted onboarding.
Discover how AI is slashing engineering Time-to-Value (TTV) and making new hires productive faster. Learn key strategies for accelerated onboarding. Here's what works.
Open related article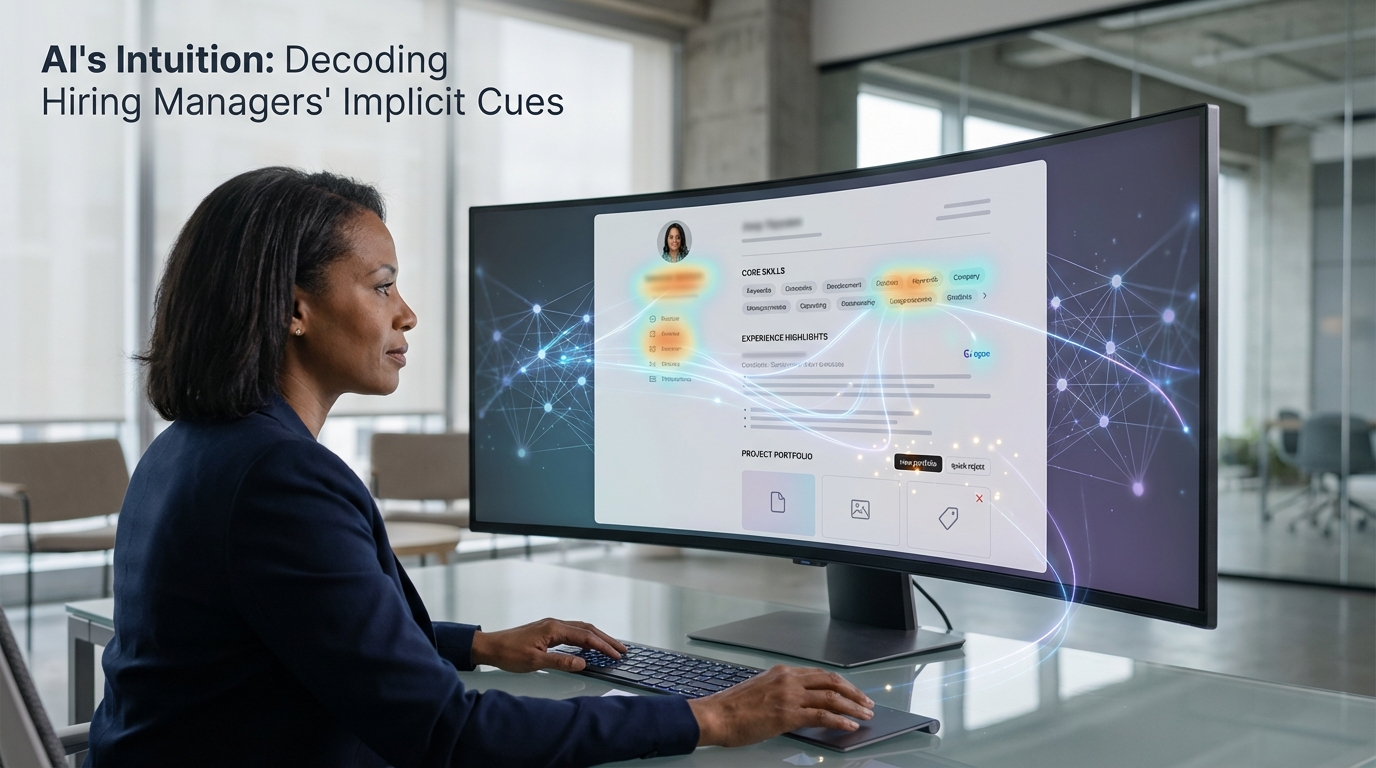
Hiring Manager Preferences: How AI Learns What 'Good' Looks Like
Infographic illustrating how AI learns hiring manager preferences via behavioral telemetry and candidate interaction data.
Discover how AI learns hiring manager preferences beyond keywords through behavioral telemetry. Optimize your recruitment strategy. Learn how.
Open related article
The High Cost of Bad Hires: Reducing False Positives in Technical Screening
Infographic detailing the significant financial costs and productivity losses associated with poor technical hires.
Discover the high cost of bad tech hires & learn strategies to reduce false positives in technical screening. AI's impact on hiring. Learn how.
Open related article
Autonomous Recruiting Velocity: Key Metrics You Need to Track
Infographic illustrating the 7 key metrics for autonomous recruiting velocity, emphasizing speed and efficiency gains.
Discover the 7 essential metrics for autonomous recruiting velocity. Measure speed, efficiency, and candidate experience to gain a competitive edge. Learn how.
Open related article
The Self-Correcting Talent Pipeline: Building Continuous Feedback into Your Hiring
Infographic illustrating a self-correcting talent pipeline with feedback loops and AI integration for enhanced hiring.
Build a self-correcting talent pipeline with continuous feedback loops. Discover how data and AI transform hiring, boost quality of hire, and reduce time-to-fill. Learn how.
Open related article
Defending the Algorithm: Answering the Hardest Legal Questions on Predictive Hiring
Infographic detailing legal questions and answers surrounding AI predictive hiring algorithms for compliance.
Confused by legal questions on predictive hiring AI? Understand discrimination, bias, and data privacy for compliant AI talent acquisition. Learn how.
Open related article
Engineering Manager Salaries vs. Productivity: The True ROI of Filling Roles Quickly
Infographic illustrating the 'Velocity Decay Tax' and the financial impact of a vacant Engineering Manager role on team productivity.
Discover the true cost of vacant Engineering Manager roles and how faster hiring boosts team productivity and ROI. Learn about the Velocity Decay Tax. Here's what works.
Open related article
What is 'Talent Density' and Why Does It Matter for Your Engineering Team?
Infographic illustrating 'Talent Density' and its impact on engineering team efficiency, with AI augmentation.
Discover what talent density means for engineering teams in 2026 and how AI-augmented productivity can eliminate coordination tax. Learn how.
Open related article
Rejection Taxonomy: Turning Candidate Feedback into Predictive Hiring Intelligence
Infographic illustrating the 4-tier rejection taxonomy for candidate feedback, highlighting predictive hiring intelligence.
Transform candidate feedback into predictive hiring intelligence. Learn how a 4-tier rejection taxonomy fuels smarter sourcing & reduces bias. Find your next hire faster.
Open related article
3x Faster Hiring: The Autonomous Recruiting Engine That Unlocks Your Roadmap
Infographic illustrating the benefits of autonomous recruiting for faster hiring and roadmap acceleration.
Escape the 'Roadmap Lock' with Suitable AI's autonomous recruiting engine. Achieve 3x faster hiring and accelerate your product roadmap. Learn how.
Open related article
Emerging Tech Hubs for Engineering Talent in 2026: Where to Look Next
Infographic showing emerging tech hubs for engineering talent in 2026 with icons representing compliance, AI, and talent.
Discover the top emerging tech hubs for engineering talent in 2026. Focus on compliance, IP protection, and sovereign AI infrastructure. Learn where to look next.
Open related article
The 'Counter-Offer' Myth: Why Friction, Not Compensation, Drives Engineering Drop-Offs
Infographic illustrating the myth of counter-offers driving engineering attrition, highlighting friction and lack of respect as primary causes.
Discover why engineers leave: it's often friction & lack of respect, not just pay. Uncover real retention strategies beyond counter-offers. Learn how.
Open related article
Debunking the 'Black Box' Myth: Why AI Hiring is More Objective Than Human Recruiters
Infographic illustrating AI hiring objectivity vs. human bias, highlighting data-driven decision-making.
Debunking the 'black box' myth. Discover how AI hiring offers greater objectivity and fairness than human recruiters. Learn how.
Open related article
How We Filled 3 Senior Golang Roles in 14 Days During a Massive Talent Shortage
Infographic detailing the 4 phases of autonomous hiring to fill 3 senior Golang roles in 14 days during a talent shortage.
Overcome massive talent shortages! Learn how we filled 3 senior Golang roles in just 14 days using an autonomous, speed-focused hiring framework. Here's what works.
Open related article
Q1 2026 India Engineering Market Signals: Why Passive Talent is Costing You Active Sprints
Infographic showing Q1 2026 India engineering market trends, highlighting the impact of passive talent on project sprints and recruitment times.
Unlock India's Q1 2026 engineering talent secrets. Discover how passive candidates impact active sprints & learn proactive strategies. Find your next hire.
Open related article
Autonomous Recruiting vs. Legacy Agencies: A Velocity Comparison
Infographic comparing autonomous recruiting systems vs. legacy agencies, highlighting speed, candidate experience, and cost benefits.
Compare autonomous recruiting systems and legacy agencies. Discover the velocity gap and the future of talent acquisition. Learn how.
Open related article
Cultural Blueprint Matching: Building Teams That Last
Infographic illustrating AI-powered Cultural Blueprint Matching, showing interlocking behavioral archetypes for team synergy.
Move beyond 'culture fit' to AI-powered 'Cultural Blueprint Matching'. Build high-performing, un-poachable teams that last. Learn how.
Open related article
Autonomous Recruiting Velocity: Your Competitive Edge in Tech Hiring
Infographic comparing manual hiring time-to-offer with significantly reduced autonomous recruiting velocity timelines.
Boost tech hiring speed with autonomous recruiting velocity. Reduce 'Time-to-Offer' & 'Opportunity Capture Latency' with AI sourcing. Learn how.
Open related article
Interviewer Calibration AI: Reducing Bias and Improving Candidate Assessment
Infographic illustrating AI interviewer calibration steps: mapping shadow rubric, live nudging, and augmented calibration sessions to reduce hiring bias.
Discover how AI-driven interviewer calibration minimizes bias and enhances candidate assessment, going beyond simple bias reduction. Learn more.
Open related article
Time-to-Hire Metrics That Actually Matter for Engineering
Infographic illustrating key engineering time-to-hire metrics like Time-to-Impact-Velocity (TTIV) and Candidate Experience Debt (CXD) for better hiring outcomes.
Beyond speed, discover crucial engineering time-to-hire metrics like TTIV and CXD that impact velocity and offer acceptance. Learn what works.
Open related article
The $50,000 Resume Mistake: Why Agency Candidates Fail
Infographic illustrating the 'Billable Onboarding Gap' and its financial impact on agencies hiring new candidates.
Discover the $50,000 resume mistake costing agencies big. Learn why traditional resumes fail and how to hire candidates who boost billable velocity and RPE. Here's what works.
Open related article
When AI Meets HR: Predictive Models for Engineer Retention
Infographic illustrating AI-powered engineer retention analytics, highlighting predictive models and data sources for spotting flight risks.
Struggling with engineer retention in 2026? Discover how AI predictive models go beyond generic HR to pinpoint flight risks. Learn how.
Open related article
Navigating Global Payroll & Tax: A Checklist for Remote Teams
Infographic checklist for navigating global payroll and tax compliance for remote teams, highlighting AI decision logs and EOR usage.
Navigate global payroll & tax complexities for remote teams with our 2026 checklist. Prevent misclassification & PE risk. Learn how.
Open related article
3x Faster Hiring: How Autonomous Recruiting Unlocks Product Velocity
Infographic illustrating the benefits of autonomous recruiting for accelerating product velocity and engineering team efficiency.
Unlock product velocity with autonomous recruiting. Discover how to shield engineers, slash hiring time, and build a skills-first architecture. Learn more.
Open related article
Talent Density: The Secret Sauce to High-Performing Engineering Teams
Infographic illustrating the concept of Talent Density, showing AI amplifying individual engineers to reduce coordination tax and increase output.
Discover the secret to high-performing engineering teams: Talent Density. Learn how AI amplifies exceptional individuals, reduces coordination tax, and reshapes the future of software development. Learn how.
Open related article
The True Cost of an Open Engineering Seat: Beyond the Salary
Infographic illustrating the multifaceted costs of an open engineering seat, including recruitment, lost productivity, and market velocity impacts.
Discover the true cost of an open engineering seat beyond salary. Learn about recruitment, lost productivity, and market velocity debt. Here's what works.
Open related article
GCC vs. Traditional Outsourcing: A Compliance and Cost Breakdown
Infographic comparing GCC vs. traditional outsourcing on compliance, cost, and IP ownership for AI development.
GCCs offer AI IP control & compliance sovereignty unlike traditional outsourcing. See the cost & compliance breakdown for 2026. Learn how.
Open related article
Decoding the 'Perfect Fit': Beyond Technical Skills with Predictive AI
Infographic illustrating how predictive AI identifies diverse talent for a competitive advantage, moving beyond traditional technical skill assessment.
Discover how predictive AI can move beyond technical skills to find your perfect hire, fostering innovation and building a competitive AI moat. Learn more.
Open related article
The 48-Hour Urgent Backfill Strategy: Minimizing Disruption When Senior Engineers Quit
Diagram illustrating a 48-hour urgent backfill strategy for engineering teams, showing phased steps from assessment to onboarding.
Lost a senior engineer? Implement a 48-hour urgent backfill strategy to minimize disruption, ensure project continuity, and maintain team momentum. Learn how.
Open related article
4 Dangerous Global Payroll Myths That Expose Your Scale-Up to Massive Fines
Infographic debunking global payroll myths for scaling businesses and highlighting risks of fines.
Don't let dangerous global payroll myths expose your scale-up to massive fines. Learn to navigate international compliance and avoid costly mistakes. Discover the truth about HRIS, labor laws, late payments, and ongoing compliance. Learn how.
Open related article
Webinar imagery
1 images
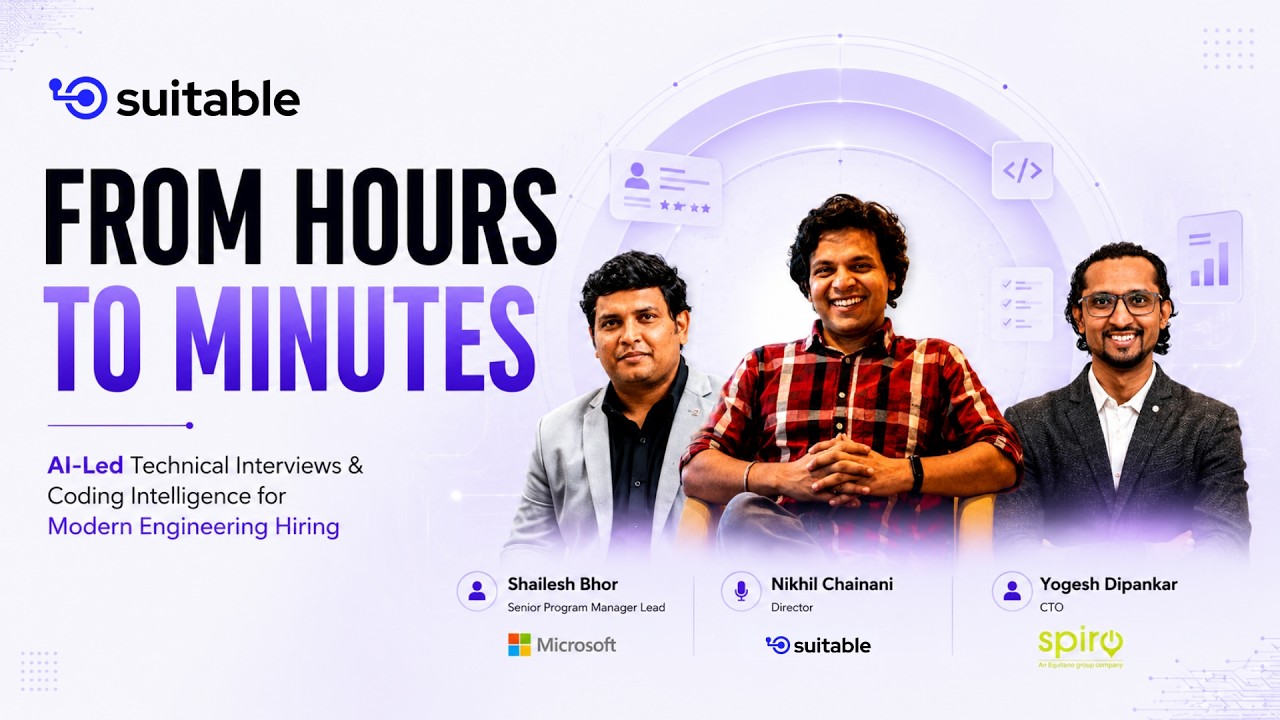
Suitable AI webinar: From Hours to Minutes
YouTube preview image for Suitable AI's webinar recap, 'From Hours to Minutes: Recap of the Webinar on the Future of Hiring.'